Bristol County Faces Sharpest Rise in Lyme Disease Cases Amongst Massachusetts Counties
Posted by Mosquito Squad
August 1, 2017
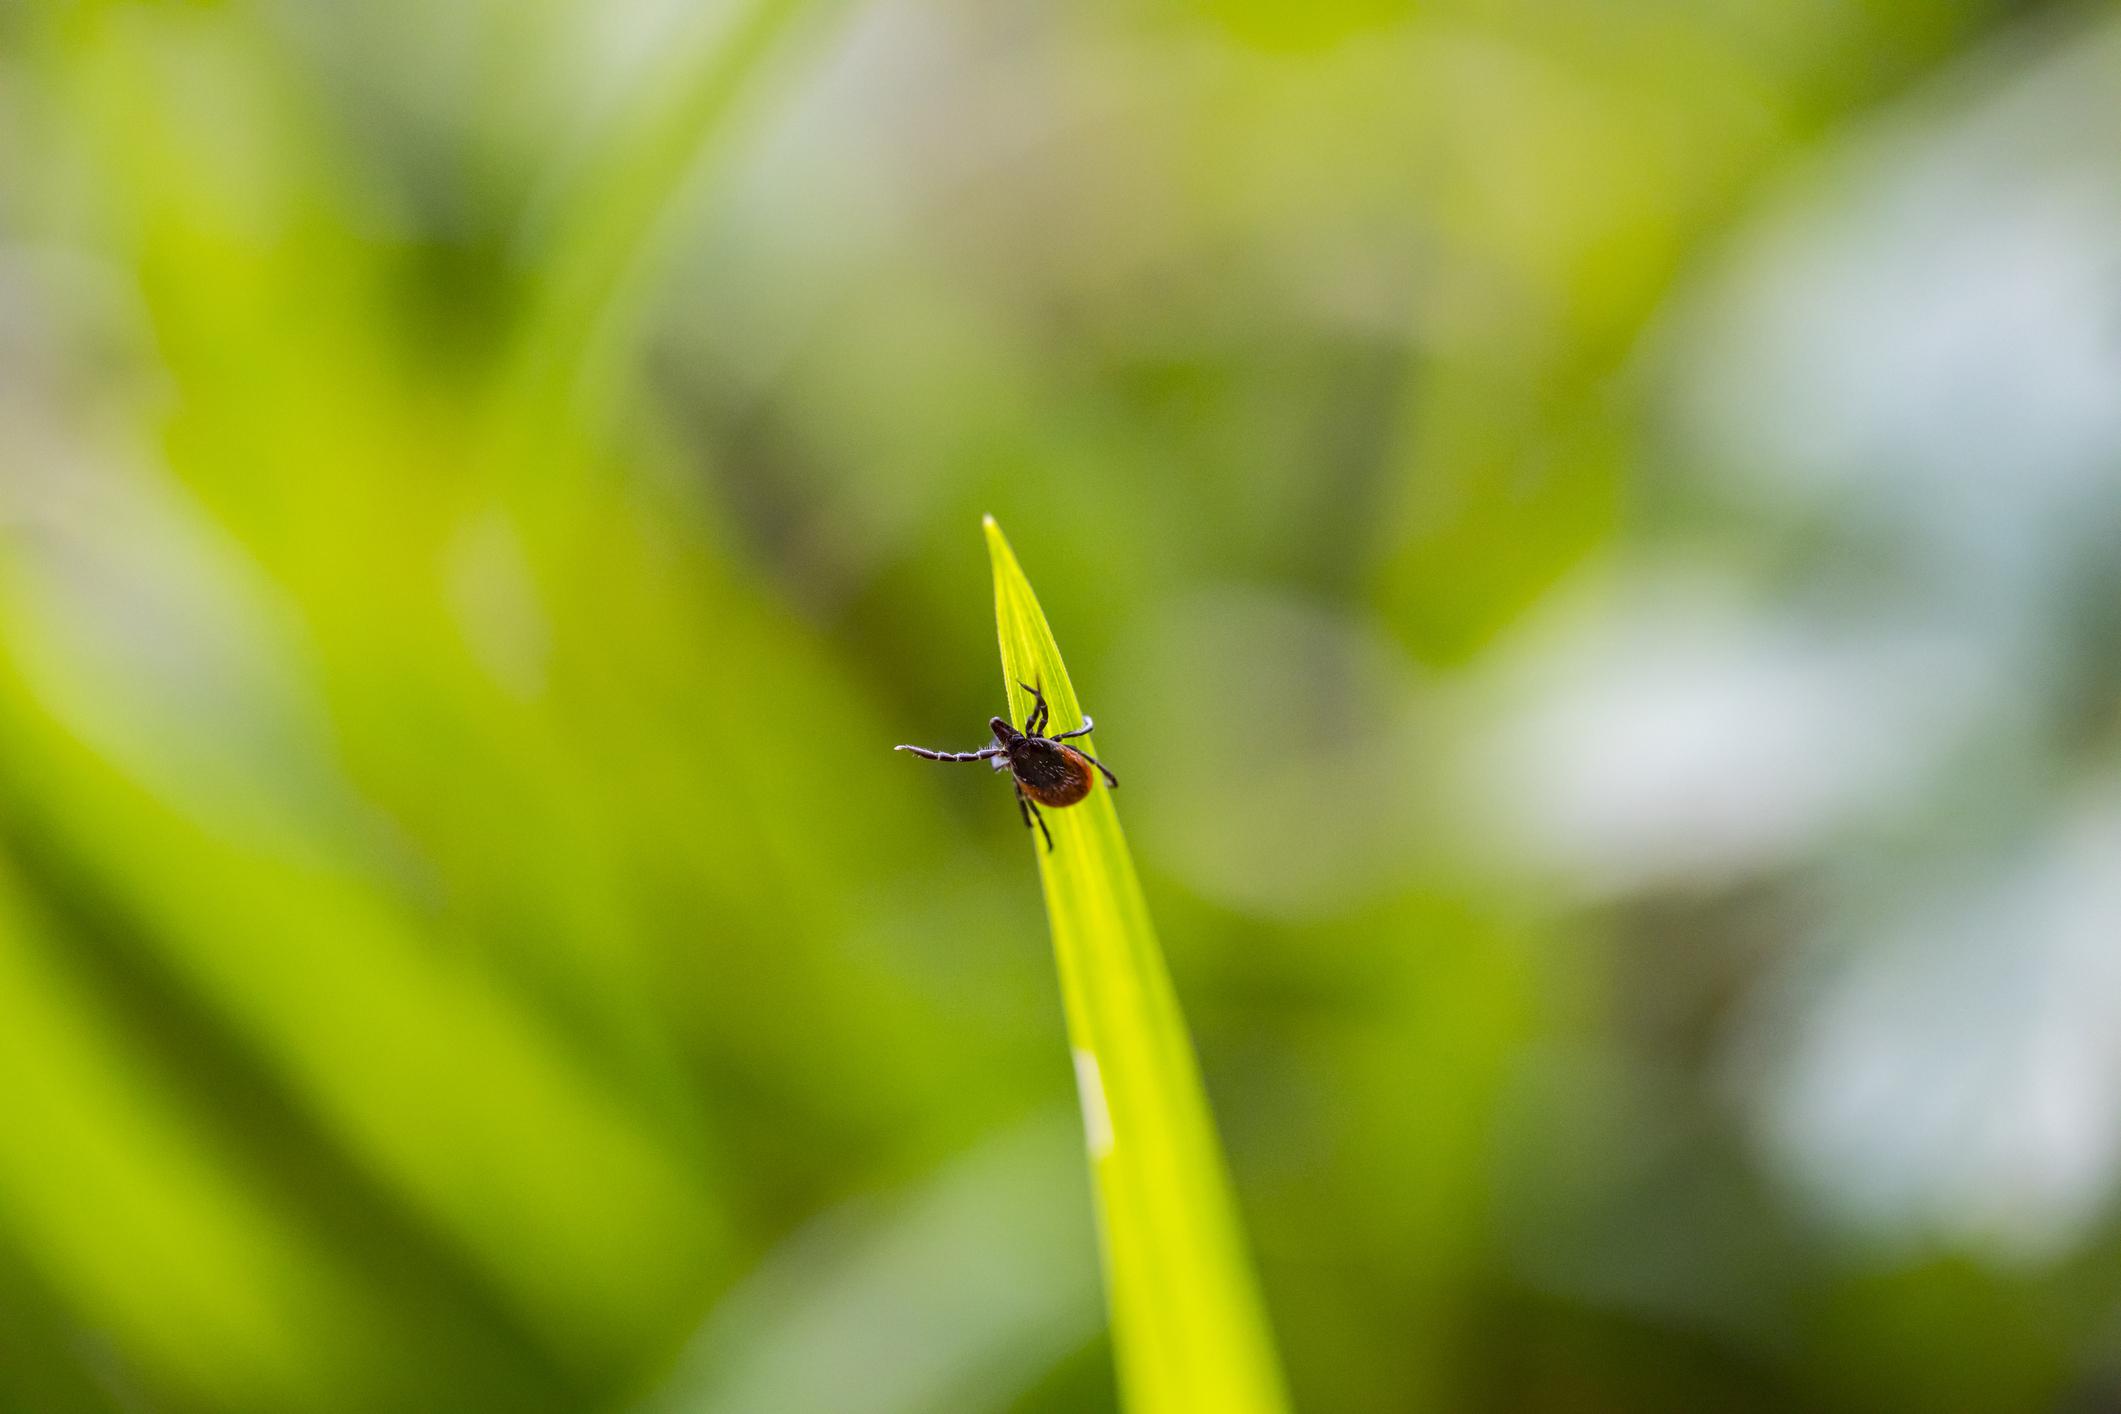
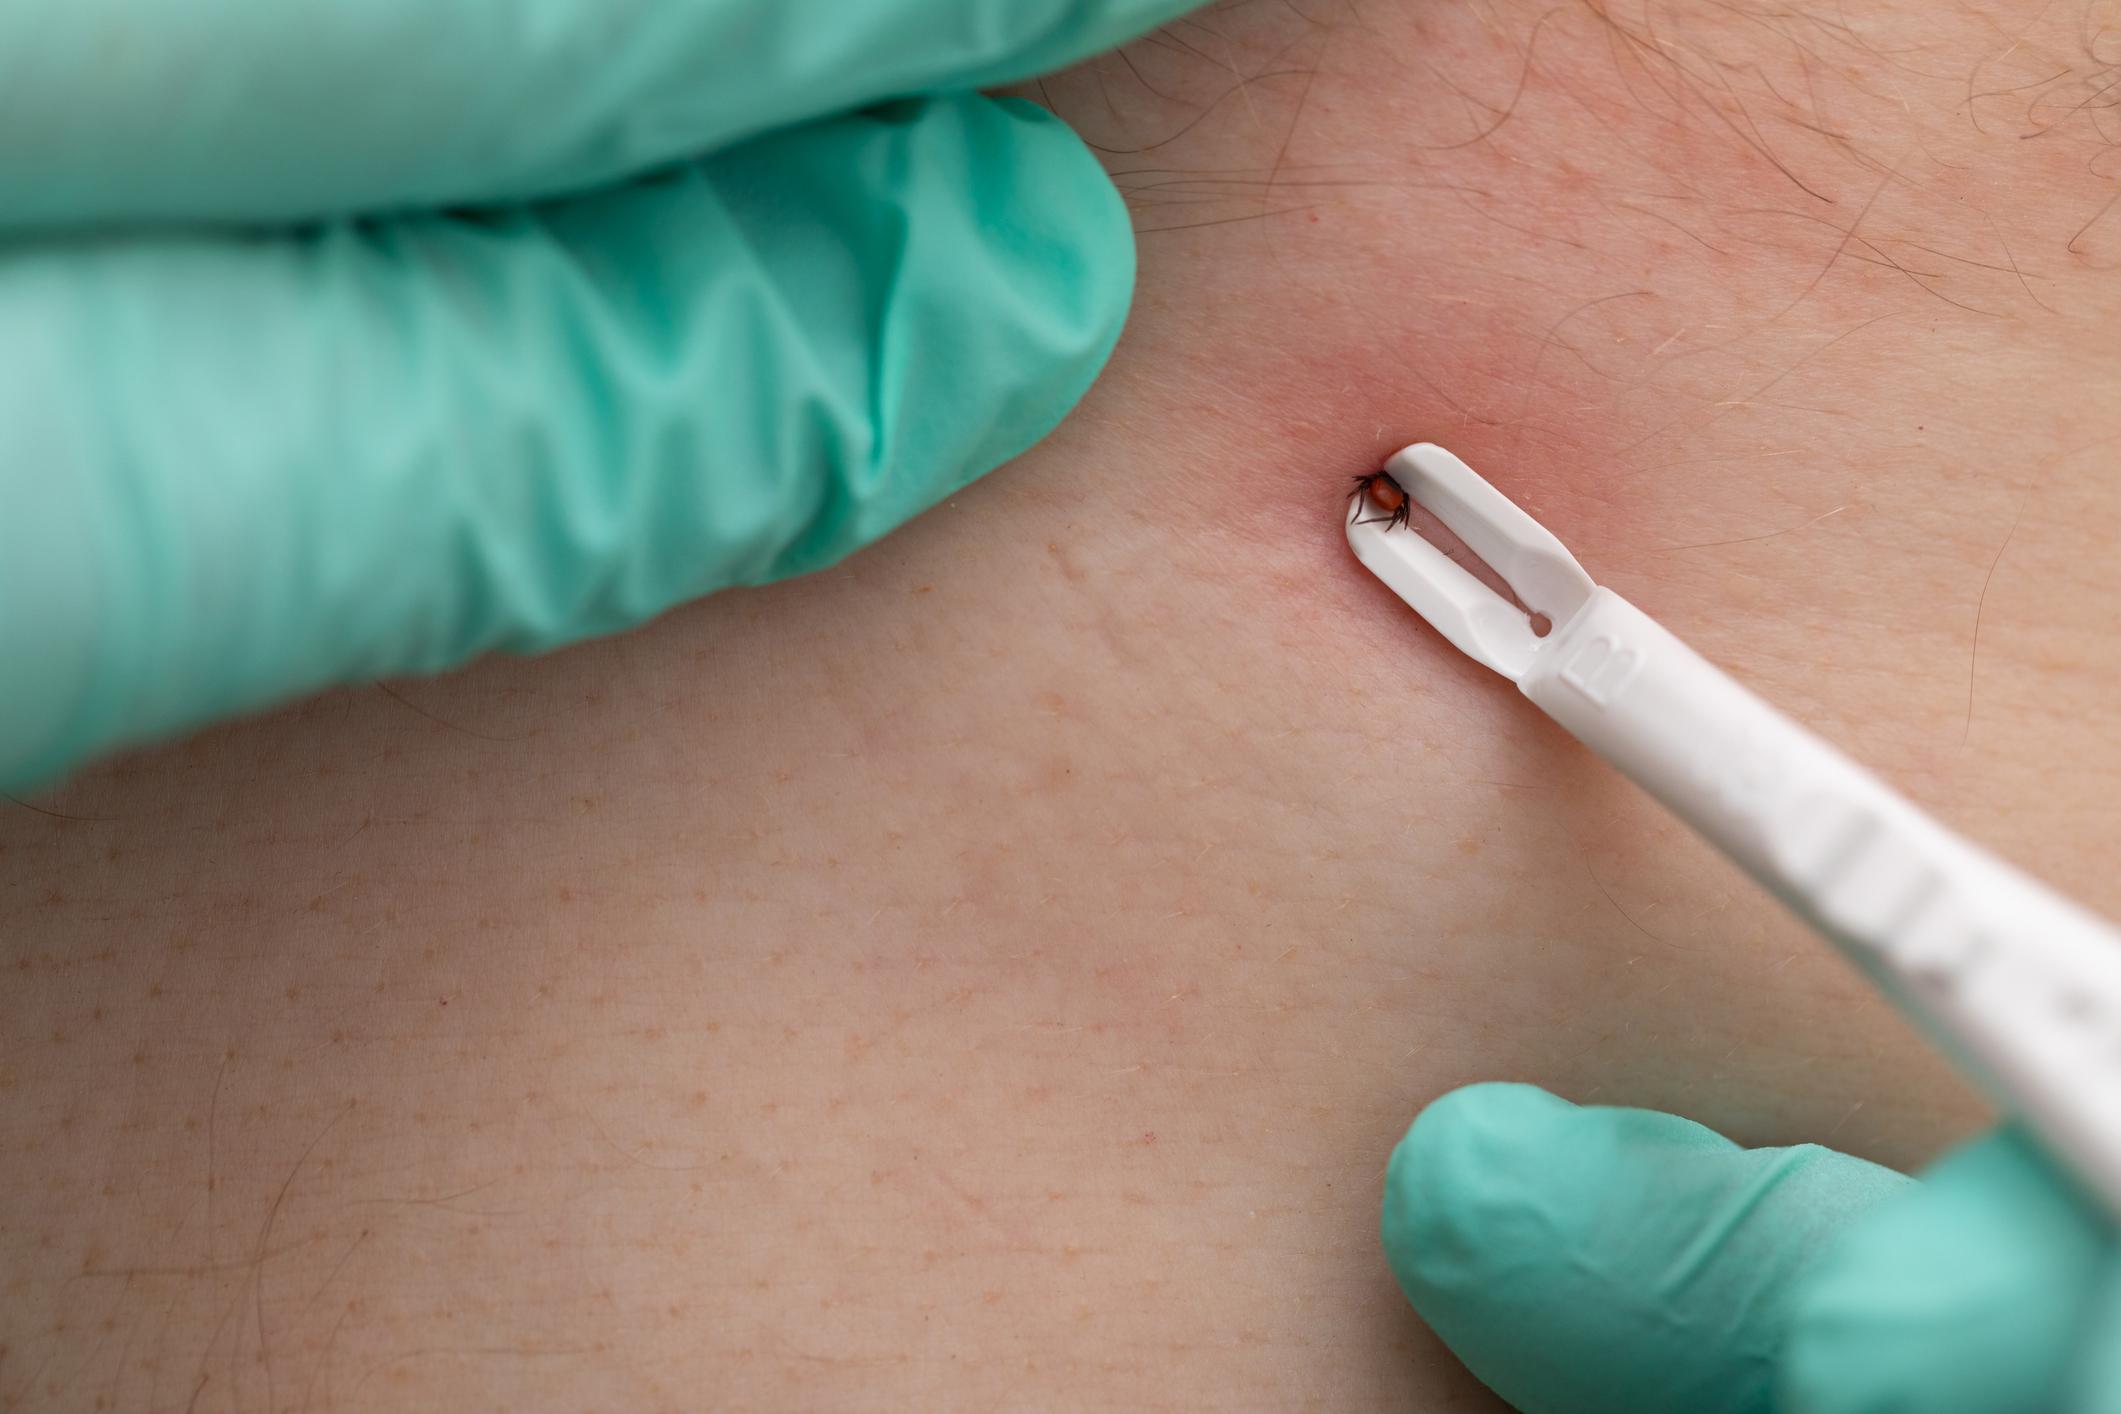
Most Massachusetts residents are quite familiar with Lyme disease and deer ticks. While you may realize it seems to be increasing every single year, do you know how much Lyme is increasing and where?
As part of their series Losing to Lyme, WBUR provided us with an extremely helpful map for visualizing the change in Lyme across the state from 2005 – 2016. It turns out that Bristol County has seen the sharpest climb in the number of Lyme disease cases with a whopping 276% increase in just over a decade. Plymouth County did not fare much better with an 83% increase in Lyme.
What About The Tick Apocalypse Predicted This Year?
You may recall that early in the spring biologists predicted a tick boom would make for a risky Lyme season. Did the prediction come to fruition to further contribute to the sharp climb in Lyme cases? Yes, so far, it is proving true. Another report from the WBUR Losing to Lyme series reports early numbers from several Northeastern States. While the numbers are early and just a sample to get a sense of the trends, each states’ increase varied widely. While New Hampshire is experiencing a 96% increase over last year, Massachusetts, where Lyme was already at epidemic levels is seeing a 14% increase over last year. While 14% might not seem huge, relatively speaking, you can see how quickly the rise in numbers could add up over just a few years’ time.
The best method of Lyme disease prevention is still in the prevention of tick bites. With Mosquito Squad of Fall River and the South Shore on your side, we can eliminate up to 90% of ticks on your property. When not at home, be sure to follow tick safety guides to lower your risks.

